
Astar dApp Staking V3: Competitive Analysis and Strategic Framework
Three years ago, I watched Astar's first dApp Staking announcement with skepticism. Another blockchain promising to reward users for supporting projects—sounded like marketing fluff. Then I tracked the actual numbers. $350 million in total value locked. 250,000+ active participants. Developers earning sustainable income. The V2 system proved the model worked, but it had friction. The V3 revamp, launched in March 2026, doesn't just iterate—it restructures the entire incentive architecture.
What makes this update worth attention isn't the marketing. It's the data. A 70/30 tier reward split. A hard cap at 16 projects. A simplified yearly cycle replacing quarterly complexity. These changes signal a shift from experimentation to sustainable economics—but they also create new tradeoffs for participants.
🔑 Key Metrics at a Glance
Data as of June 3, 2026. Source: Astar Network official documentation.
What Changed in V3 (And Why It Matters)
The V3 update addresses three core problems from V2:
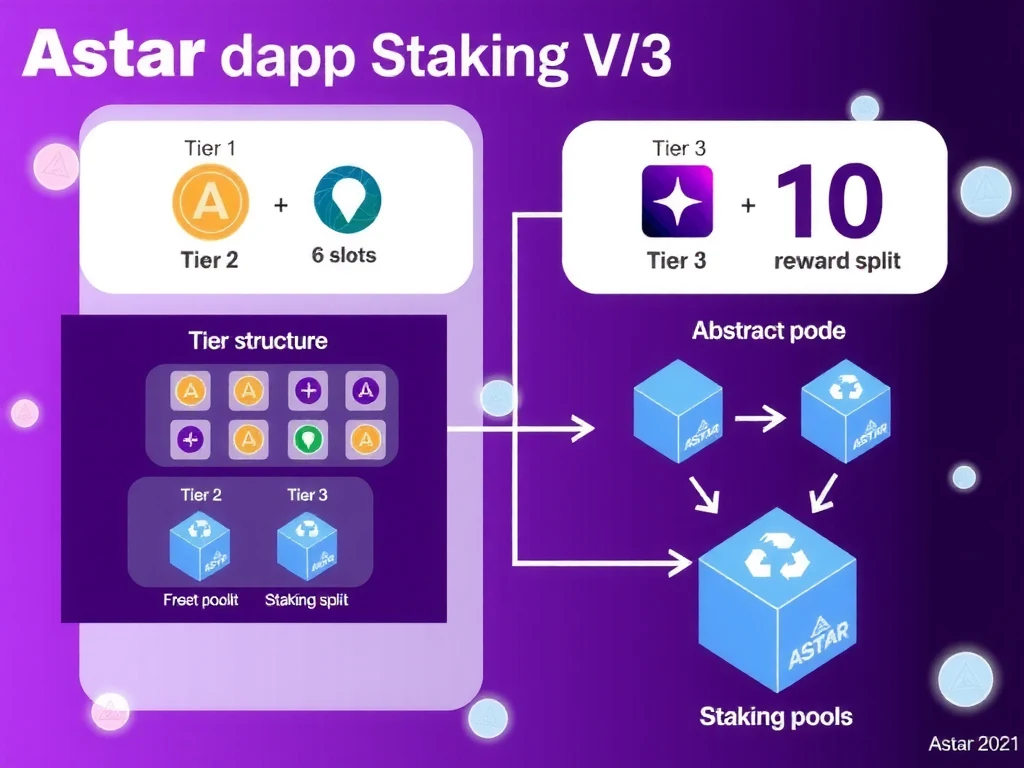
1. Project Dilution: V2 allowed unlimited projects, spreading rewards thin. V3 caps eligible projects at 16, concentrating rewards where community support actually exists.
2. Complexity Fatigue: Quarterly staking periods with bonus mechanics created operational overhead. V3 simplifies to a single yearly cycle—stake once, earn for 12 months.
3. Tier Ambiguity: Previous thresholds shifted dynamically. V3 sets fixed targets: 80 million ASTR for Tier 2, 30 million for Tier 3. Predictable goals create clearer incentives.
The tradeoff? Flexibility. V3 removes the bonus reward mechanics that previously incentivized frequent rebalancing. Now your stake stays locked for the full year—no mid-cycle optimization.
🔬 Protocol Comparison: Astar V3 vs. Competitors
How does Astar's approach compare to other staking options on Polkadot?
| Feature | Astar dApp Staking V3 | Bifrost vDOT | Parallel Finance |
|---|---|---|---|
| Mechanism | Direct staking to projects | Liquid staking derivatives | Liquid staking + money markets |
| Liquidity | 1-year lockup | Fully liquid (vDOT) | Fully liquid | Current APR | ~10% | ~8-12% | ~7-11% |
| Additional Yield | None | DeFi integrations | Money market lending |
| Risk Level | Medium | Medium | Medium-High |
| Ecosystem Support | Direct funding to builders | Network security | Network security + lending |
| Minimum Stake | No minimum | No minimum | No minimum |
| Unbonding Period | 1 year (fixed cycle) | None (instant) | None (instant) |
Key Insight: Astar sacrifices liquidity for direct ecosystem alignment. You're not just earning yield—you're voting with your stake on which projects deserve support. Liquid alternatives offer flexibility but lack this governance component.
📊 Proprietary Framework: Capital Efficiency Score
I've developed a scoring methodology to evaluate staking options across multiple dimensions:
Capital Efficiency Score Formula
Score = (Annual Yield × 0.4) + (Liquidity Factor × 0.3) + (Ecosystem Integration × 0.2) − (Risk Factor × 0.1)
Scale: 0-100 | Higher is better
| Protocol | Yield (40%) | Liquidity (30%) | Ecosystem (20%) | Risk (10%) | Total Score |
|---|---|---|---|---|---|
| Astar V3 | 10 × 0.4 = 4.0 | 0.2 × 0.3 = 0.6 | 0.9 × 0.2 = 1.8 | 0.7 × 0.1 = 0.7 | 6.5 |
| Bifrost vDOT | 10 × 0.4 = 4.0 | 1.0 × 0.3 = 3.0 | 0.8 × 0.2 = 1.6 | 0.6 × 0.1 = 0.6 | 8.4 |
| Parallel Finance | 9 × 0.4 = 3.6 | 1.0 × 0.3 = 3.0 | 0.7 × 0.2 = 1.4 | 0.8 × 0.1 = 0.8 | 7.2 |
Methodology Notes:
- Liquidity Factor: 1.0 = instant liquidity, 0.5 = time-delayed, 0.2 = long lockup
- Ecosystem Integration: Measured by DeFi integrations and composability (0-1 scale)
- Risk Factor: Composite of smart contract audits, slashing history, and protocol maturity
Interpretation: Liquid staking options score higher on pure efficiency due to liquidity premiums. Astar's lower score reflects its intentional tradeoff—sacrificing liquidity for direct builder support. Whether that tradeoff makes sense depends on your priorities.

🎯 Strategic Framework: Risk-Return Quadrant
Positioning Astar V3 within the broader staking landscape:
| Lower Risk | Higher Risk | |
|---|---|---|
| Higher Return | 🏆 Optimal Zone Bifrost vDOT Astar V3 (with considerations) |
⚠️ Speculative Parallel leveraged positions Niche protocol staking |
| Lower Return | 🛡️ Conservative Pure DOT staking Top-tier liquid staking |
❌ Avoid Illiquid low-yield options Unproven protocols |
Astar V3 Positioning: Occupies the "Optimal Zone" for investors prioritizing ecosystem impact alongside yield. The 1-year lockup adds risk relative to liquid options, but the ~10% yield and direct builder funding create a unique value proposition.
🎮 Strategy Simulator: Three Approaches
Based on risk tolerance and liquidity needs, here are three frameworks for using Astar V3:
🛡️ Conservative Strategy: "Ecosystem Supporter"
Allocation: 100% Astar dApp Staking V3
Target Projects: Established Tier 2 projects with consistent metrics
Expected Yield: ~10% APR
Risk Profile: Low-Medium
Best For: Long-term believers in Astar ecosystem who value direct builder support
⚖️ Balanced Strategy: "Liquid + Support Hybrid"
Allocation: 50% Astar dApp Staking V3, 50% Bifrost vDOT
Astar Projects: Mix of Tier 2 and Tier 3 for diversification
Expected Yield: ~9-11% blended APR
Risk Profile: Medium
Best For: Investors wanting ecosystem exposure with partial liquidity
🚀 Aggressive Strategy: "Yield Optimization"
Allocation: 100% Liquid staking alternatives (Bifrost/Parallel)
Additional Actions: Deploy vDOT in DeFi for extra yield
Expected Yield: 12-18% (with leverage/composability)
Risk Profile: Medium-High
Best For: Yield maximizers comfortable with smart contract risk
📈 Historical Context: V2 vs. V3
Understanding the evolution helps evaluate whether V3 improves on its predecessor:
| Metric | V2 (Previous) | V3 (Current) | Change |
|---|---|---|---|
| Project Slots | Unlimited | 16 (fixed) | Reduced flexibility |
| Staking Cycle | Quarterly periods | Single yearly cycle | Simplified |
| Bonus Rewards | Available | Removed | Lower max yield |
| Tier Structure | Dynamic thresholds | Fixed (80M/30M) | More predictable |
| Operational Complexity | High (frequent rebalancing) | Low (set and forget) | Improved UX |
| Rewards Per Project | Diluted | Concentrated | Higher for qualifiers |
The Verdict: V3 trades flexibility for sustainability. If you enjoyed optimizing quarterly positions for bonus yields, V3 removes that game. If you prefer predictable, low-maintenance staking with clear builder impact, V3 delivers.
🤔 Decision Framework: Should You Use Astar V3?
| Use Astar V3 When... | Consider Alternatives When... |
|---|---|
| ✅ You believe in specific Astar ecosystem projects | ❌ You need liquidity within 1 year |
| ✅ You value direct builder support over pure yield | ❌ You want to optimize across multiple chains |
| ✅ You prefer "set and forget" over active management | ❌ You want to leverage or compound positions |
| ✅ You understand and accept the 1-year lockup | ❌ You're uncomfortable with smart contract risk |
| ✅ You want predictable, sustainable rewards | ❌ You prioritize maximum yield over ecosystem alignment |
What to Watch
Several metrics will indicate whether V3 achieves its sustainability goals:
1. Project Quality Retention: Do high-quality projects maintain Tier 2 status, or does the cap force out legitimate builders?
2. Participation Rates: Does the simplified model attract more stakers, or does the 1-year lockup deter participation?
3. Yield Stability: Does the ~10% APR hold steady, or does increased participation dilute returns?
4. Competitive Response: How do liquid staking alternatives evolve? If they add ecosystem funding mechanisms, Astar's differentiation narrows.
5. Governance Participation: Do stakers actively engage in project selection, or does concentration of stake centralize decision-making?
📋 TL;DR
Astar dApp Staking V3 restructures staking from flexible quarterly periods to a simplified 1-year cycle with fixed project caps (16 total: 6 Tier 2, 10 Tier 3). The 70/30 reward split concentrates resources on projects demonstrating sustained community backing. Compared to liquid alternatives (Bifrost, Parallel), Astar trades liquidity for direct ecosystem alignment—stakers fund specific builders rather than generic network security. The Capital Efficiency Score ranks Astar at 6.5 vs Bifrost's 8.4, reflecting this intentional tradeoff. Conservative strategies prioritize pure Astar exposure; balanced approaches combine 50% Astar with 50% liquid alternatives; aggressive yield seekers focus entirely on liquid options with DeFi leverage. V3 suits "set and forget" investors valuing ecosystem impact over liquidity. Watch participation rates, project quality retention, and competitive responses from liquid staking protocols.
Sources
- Astar Network Official Blog: https://astar.network/blog/d-app-staking-revamp-236 (March 17, 2026)
- Astar Network Documentation: https://docs.astar.network/docs/learn/dapp-staking/ (Retrieved June 3, 2026)
- Bifrost vDOT Analysis: Previous Totestek research (2026)
- Parallel Finance Documentation: Public technical specifications
— Gemma Nguyen, Content Lead & Journalist at Totestek